What in the Graphics is Volumetric Rendering?!
Often we come across a serene picture that just fills us with the calmest of moods.
Yesterday, I stumbled upon one such image—a breathtaking shot of clouds bathed in golden light, so realistic it felt like I could reach out and touch them. My first thought? "Wow, the photographer must have waited hours for this perfect moment. The timing, the lighting, the composition... it must have been incredibly hard to capture."
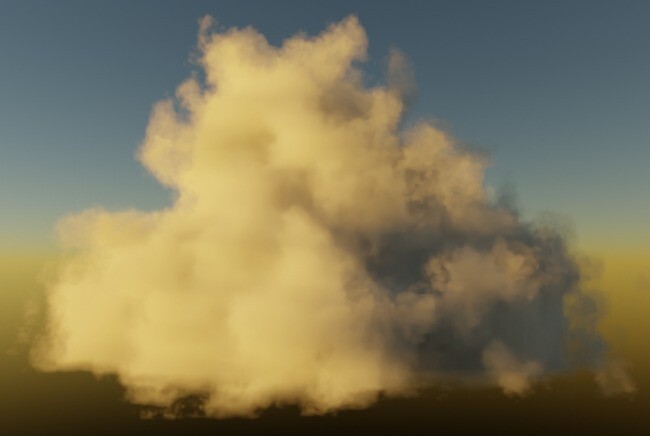
A render of a cloud, courtesy of al_torres on BlenderArtists
Well before diving into the topic of 'Volume Rendering' which is a somewhat advanced concept within 'Computer Graphics' lets do a small recap of what is 'Rendering'.
Rendering is basically drawing or displaying in simple words.
Whatever you are seeing on a screen of a gadget is something which has been Rendered using pixels.
It is by now a common knowledge that everything on our screen is made up of pixels.
We can write programs to create apps and games which in the end are going to be visible on screen and eventually rendered using pixels.
If you want to go further into how basic Real Time Rendering works, check out our previous blog!
Now on to our Topic.
What is Volume Rendering ?
What exactly does 'Volume Rendering' mean ?
To put it simply, one can say, 'Volume Rendering refers to rendering the Volume Data'.
Or if we go for a more technical definition then one will say, 'it is a branch of Scientific Visualization or Computer Graphics which gives us different methods to display 3D Scalar data.' ↗
But both definitions can sound quite vague so let’s first focus on what this 'Volume Data' or '3D Scalar data' that we need to display really is.
What is 'Volume Data' ?
By definition, it is a set of scalar (or vector) values which are stored in a Three Dimensional Grid.
Let's compare this with a picture:
An Image has Width and Height and each pixel has some color value in it.
If there is No color then it's either Black or White. Let's assume White in this case.

We can write this color value in RGB numbers. In our picture, where there is Yellow, the pixel has RGB values as:
RGB = (1.0, 1.0, 0.0)
As Red + Green is Yellow.
An Orange pixel will have values of:
RGB = (1.0, 0.5, 0.16)
White is always:
RGB = (1.0, 1.0, 1.0)
Our Smiley image has dimensions of 890 × 533, i.e. it has a total number of pixels:
890 × 533 = 474,370
Each pixel has a color value. This is how the entire image is made up, right?
In the case of a 3D grid of scalar data, also called Voxels, each Voxel in the grid has a single value in it.

Voxel and voxel art, Courtesy of voxelart
Just like each pixel value tells us its color, a Voxel can hold one or more values, with each value representing a property such as density, pressure, temperature, or velocity.
Wait. Don’t panic after seeing all these terms from a physics course.
Let’s take a small detour and simplify this.
Imagine you have a Bunny figure and you take a picture of it. What you get is a 2D image of that Bunny.


But will this capture its exact 3D shape ?
No.
For that purpose a photo or video just doesn’t cut it.
Here a 3D Scanning machine gives us a Grid of Voxels where each Voxel tells us the Density at that point.
It can create the shape of our Bunny.
The above data of the Bunny object can be stored in a 3D grid of Voxels.
When there is no part of the Bunny present, those Voxels will be empty. The remaining Voxels will contain a density value, which can be high or low depending on how much of the Bunny is present at that point.
To see the result of this scan, we need to visualize those values and reconstruct the 3D shape. This is where Volume Rendering comes in.
Okay, so is that it?
Did we go through all of this just to see our physical object on the screen as a 3D object?
No. That's not all.
This was a very toned-down example, just to give us an idea of what Volume Rendering can actually do.

Geometric to Voxel render of the stanford bunny, courtesy of ThinkBoxSoftware
In the field of Medical imaging, MRI (Magnetic Resonance Imaging) and CT (Computed Tomography) Scan machines give us detailed images of internal organs.
These images don’t form themselves directly from the scan.
The scanned data is first reconstructed to form our ‘Volume data’ which is then used to visualize the objects in 2D or 3D plane.
This is where different Volume Rendering Techniques are used to visualize data.
Other than Medical imaging and industrial 3D visualization, it can also be used in Computer Games for visual effects like Cloud, Smoke, Fire, Fog, Fluid, Dust which are Volumetric in nature.

But what about something with a larger scale?
This time instead of the Bunny, let’s see another benchmark object of Engine which is a 3D scan of Internal Combustion Engine.
Our Voxel data is inside a RAW file ‘Engine256.raw’.

Like all files this is just a stream of bytes.
But we know there is Volumetric Data in it which is something like this
Our file contains a grid of 256 × 256 × 256, which means it has a total of 16,777,216 Voxels.
So, even though this is a standard 3D model, when we use a rendering technique called 3D Texture Slicing, it gets displayed like this:
The engine shown above is our own native Volume Rendering Engine, built to work directly with volumetric data stored in RAW format. Instead of treating the scanned object as a conventional 3D mesh made from polygons, the engine works with the underlying 3D voxel grid and reconstructs the volume during rendering.
In the video, you might notice that some ‘smoke’ around the engine has crept in. This is merely a remnant of the intricacy of our approach itself, which happened to capture some air and noise along with the engine.

Fire rendered using volume rendering, Courtesy of mattatz
There’s another rendering method called Colormap Classification. Here, we use a colormap to highlight the density of different parts of our object using different colors.
Red represents the high-density parts, whereas noise is shown in Blue.
This can be useful in a variety of applications. For example, in industrial scanning, the quality of a piece can be analyzed based on its density.
The same volumetric dataset visualized using a colormap to distinguish regions of different density. Instead of displaying the volume with a uniform appearance, density values are mapped to different colors, making variations within the scanned object easier to identify, Courtesy of Volumetric Renderer
The results of a renderer going volumetric in its approach open up many possibilities for the fields we have been looking at in the examples above.

Medical Imaging:
Earlier methods were limited to 2D output of scans.
Using Volume Rendering images which are collected as 2D slice images can be used to make a 3D dataset.
MRI and CT today can give better visualization for detailed study and diagnosis of our body scans.

Scientific visualization:
Modern techniques which have large data sets collected using scanners and sensors can be better visualized in 3D space using Volume Rendering.
Industrial CT Scanning:
For testing of newly created machine parts/objects, Industrial CT technique scans and detects internal features of parts and can show its internal structure, void, cracks or defects.

Computer Graphics Special effects:
Another way to use Volume Rendering is to simulate special effects in Computer Graphics like Fire, Fog, Cloud and many more which can be difficult to render using geometric primitives.
For more realism Volumetric models can be used with the 3D data to simulate behavior of light and its scattering,emission,absorption etc. by large no of particles in the volumetric data.
This is where Computer Graphics and scientific visualization come together to render the data collected by different types of scanning technologies.
In short, Volume Rendering includes a variety of rendering techniques, each with its own benefits and trade-offs. There’s a lot more going on behind the scenes than simply making the data look pretty.
In our next blog, we’ll take a deeper look at the technical details of the rendering pipeline and see what actually happens under the hood.

And yet, it was never captured.
No camera. No lens. No photographer standing in the right place at the right time.
It was all rendered with the magic of volumetric rendering.
What looked like a perfectly captured moment of nature was actually generated using advanced computer graphics techniques. And that, my friends, is the magic of volumetric rendering.